3.6 Adjusting the Horizontal Axis
3.6.1 MAC
RIGHT-clickon any vertical bar of the graph. From the menu, click the optionSelect Data.- Click
Editunder Horizontal (Category) Axis Labels. Click and drag over the rangeE8:E12(midpoints). - Click
OK. This is to re-label the x-axis with the midpoints replacing the upper limits. - Click OK again.
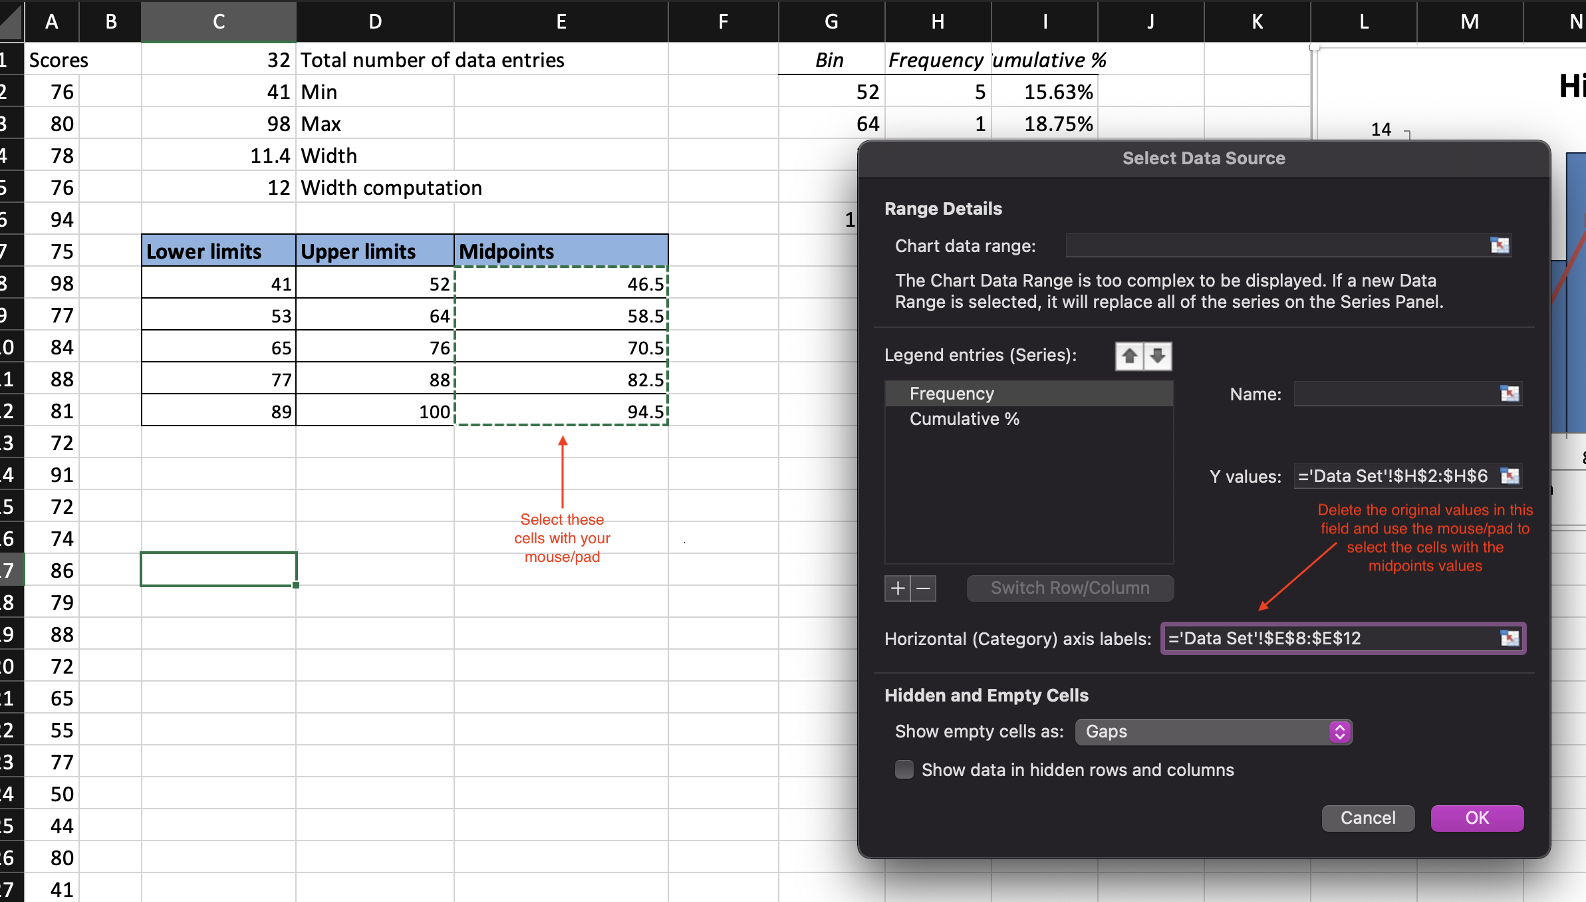
Figure 3.6: Adjusting the horizontal axis on a MAC.
3.6.2 PC
RIGHT-clickon any vertical bar of the graph. From the menu, click the optionSelect Data.- Click
Editunder Horizontal (Category) Axis Labels.
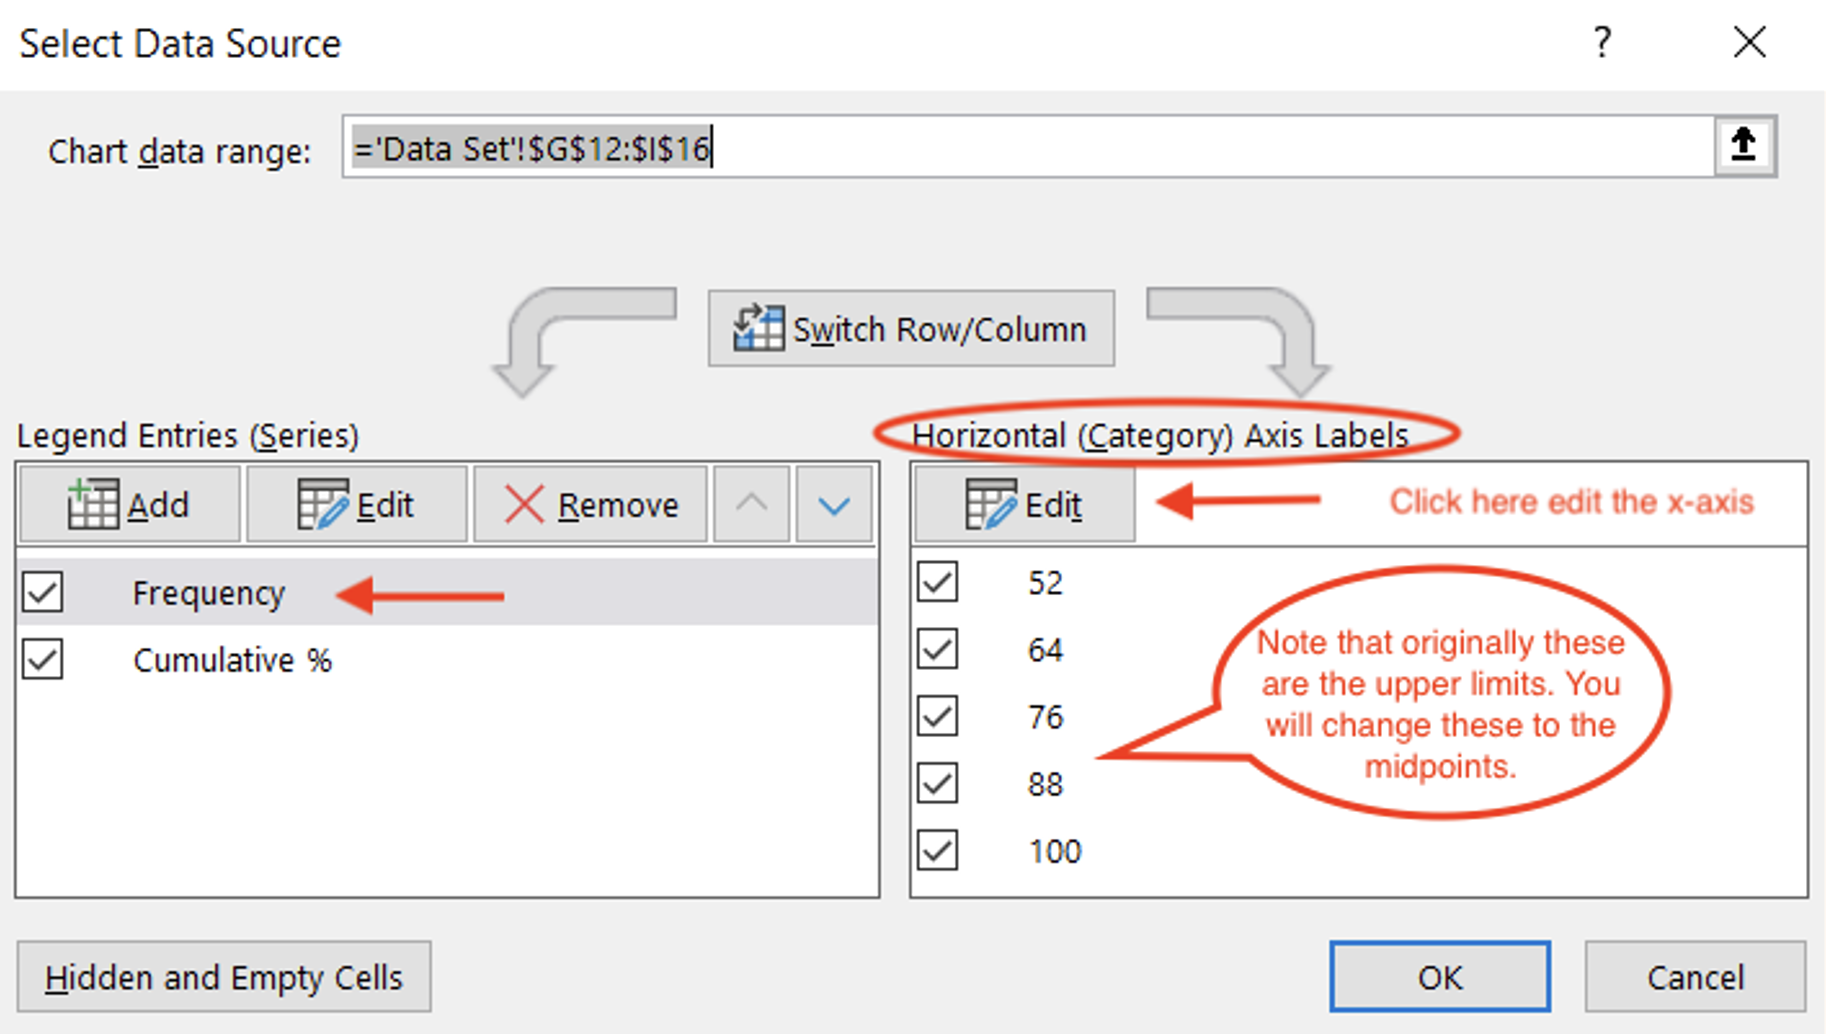
Figure 3.7: Adjusting the horizontal axis on a MAC.
- Click in the filed Axis label range, delete whatever values are in there, and drag over the range
E8:E12to select midpoints cells. - Click
OK. This is to re-label the x-axis with the midpoints instead of the upper limits. - Click
OKagain.
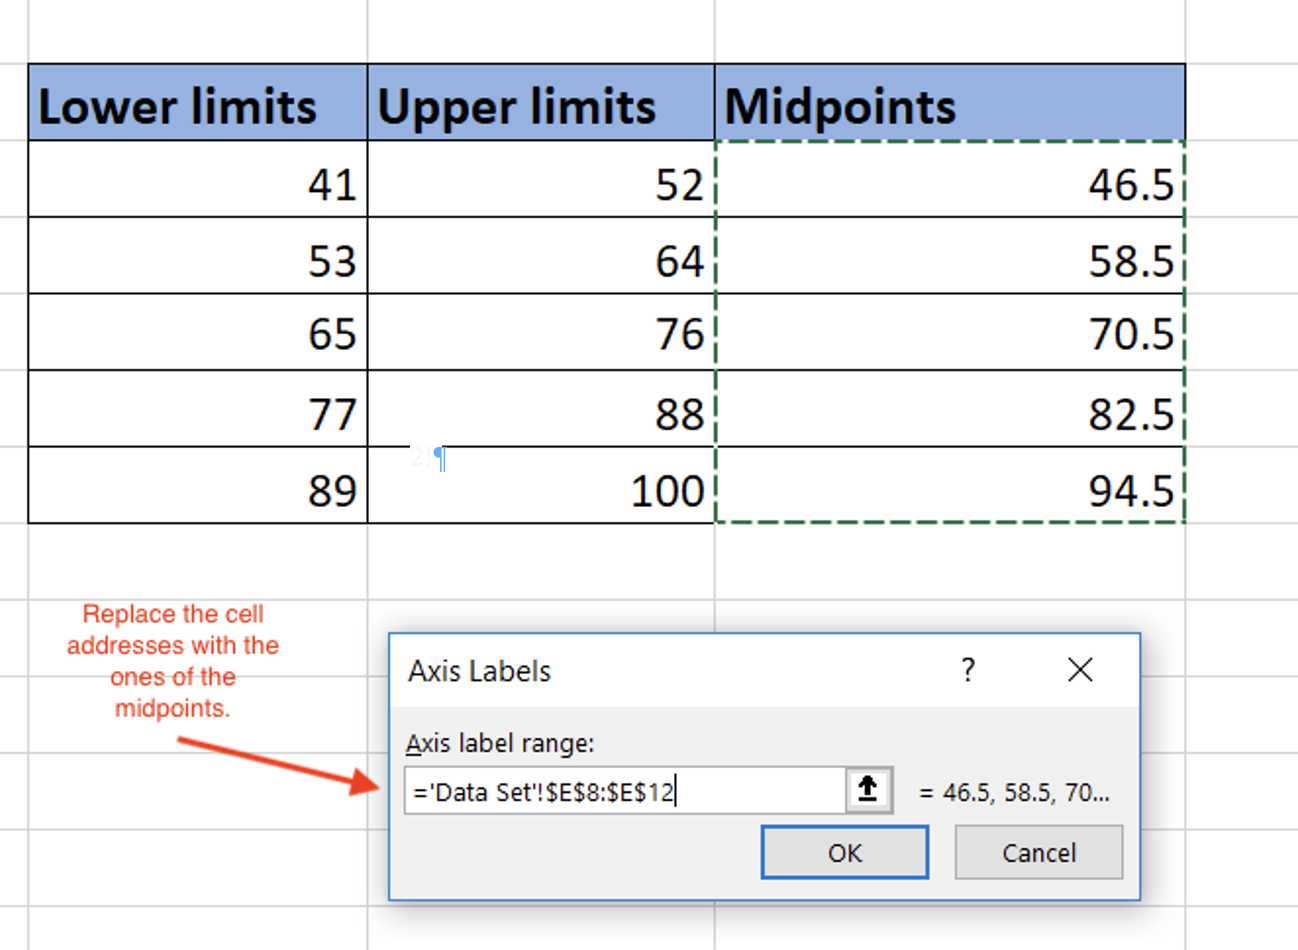
Figure 3.8: Relabeling the horizontal axis on a PC.