7.2 Percentiles
The function PERCENTILE.INC(array,k) returns the k-th percentile of values in a data set, where k is in the range 0..1, inclusive, representing the decimal form of the percentage. The function PERCENTILE.EXC(array,k) works similarly, but k is exclusive in the range 0..1.
Example: Suppose a data set contains the test scores for a class of 20 students, and you want to calculate the 80th percentile score. Assuming the test scores are in cells A1:A20, you would use the formula =PERCENTILE.INC(A1:A20, 0.80). This formula will return the value at the 80th percentile in the data set, representing the score separating the top 20% of students from the rest.
The following are instructions for you to find all percentiles of the carbon dioxide measured in Mauna Loa, Hawaii, contained in the file you downloaded.
Go to the top of an empty column and type Percentiles- Mauna Loa, Hawaii as the column’s header.
Below Percentiles- Mauna Loa, Hawaii, create a list of numbers from 1 to 99 (use the instructions in Section 5.3.4 from Lab 5 Time Series and Measures of Central Tendency).
In the column next to it, type the header Hawaii Measure.
Below Hawaii Measure, enter the formula
=PERCENTILE.INC($C$4:$C$21,L2/100).Select the cell containing the formula in Step 4.
Position the mouse pointer in the lower right corner of the selected cell until it becomes a
+sign and click-drag downward across the range that covers all the values of the Hawaii measure.
Note: In the formula above, the address of the cells containing the data set has dollar signs ($) before the row and the column number to keep the calculations from changing the location of the data set.
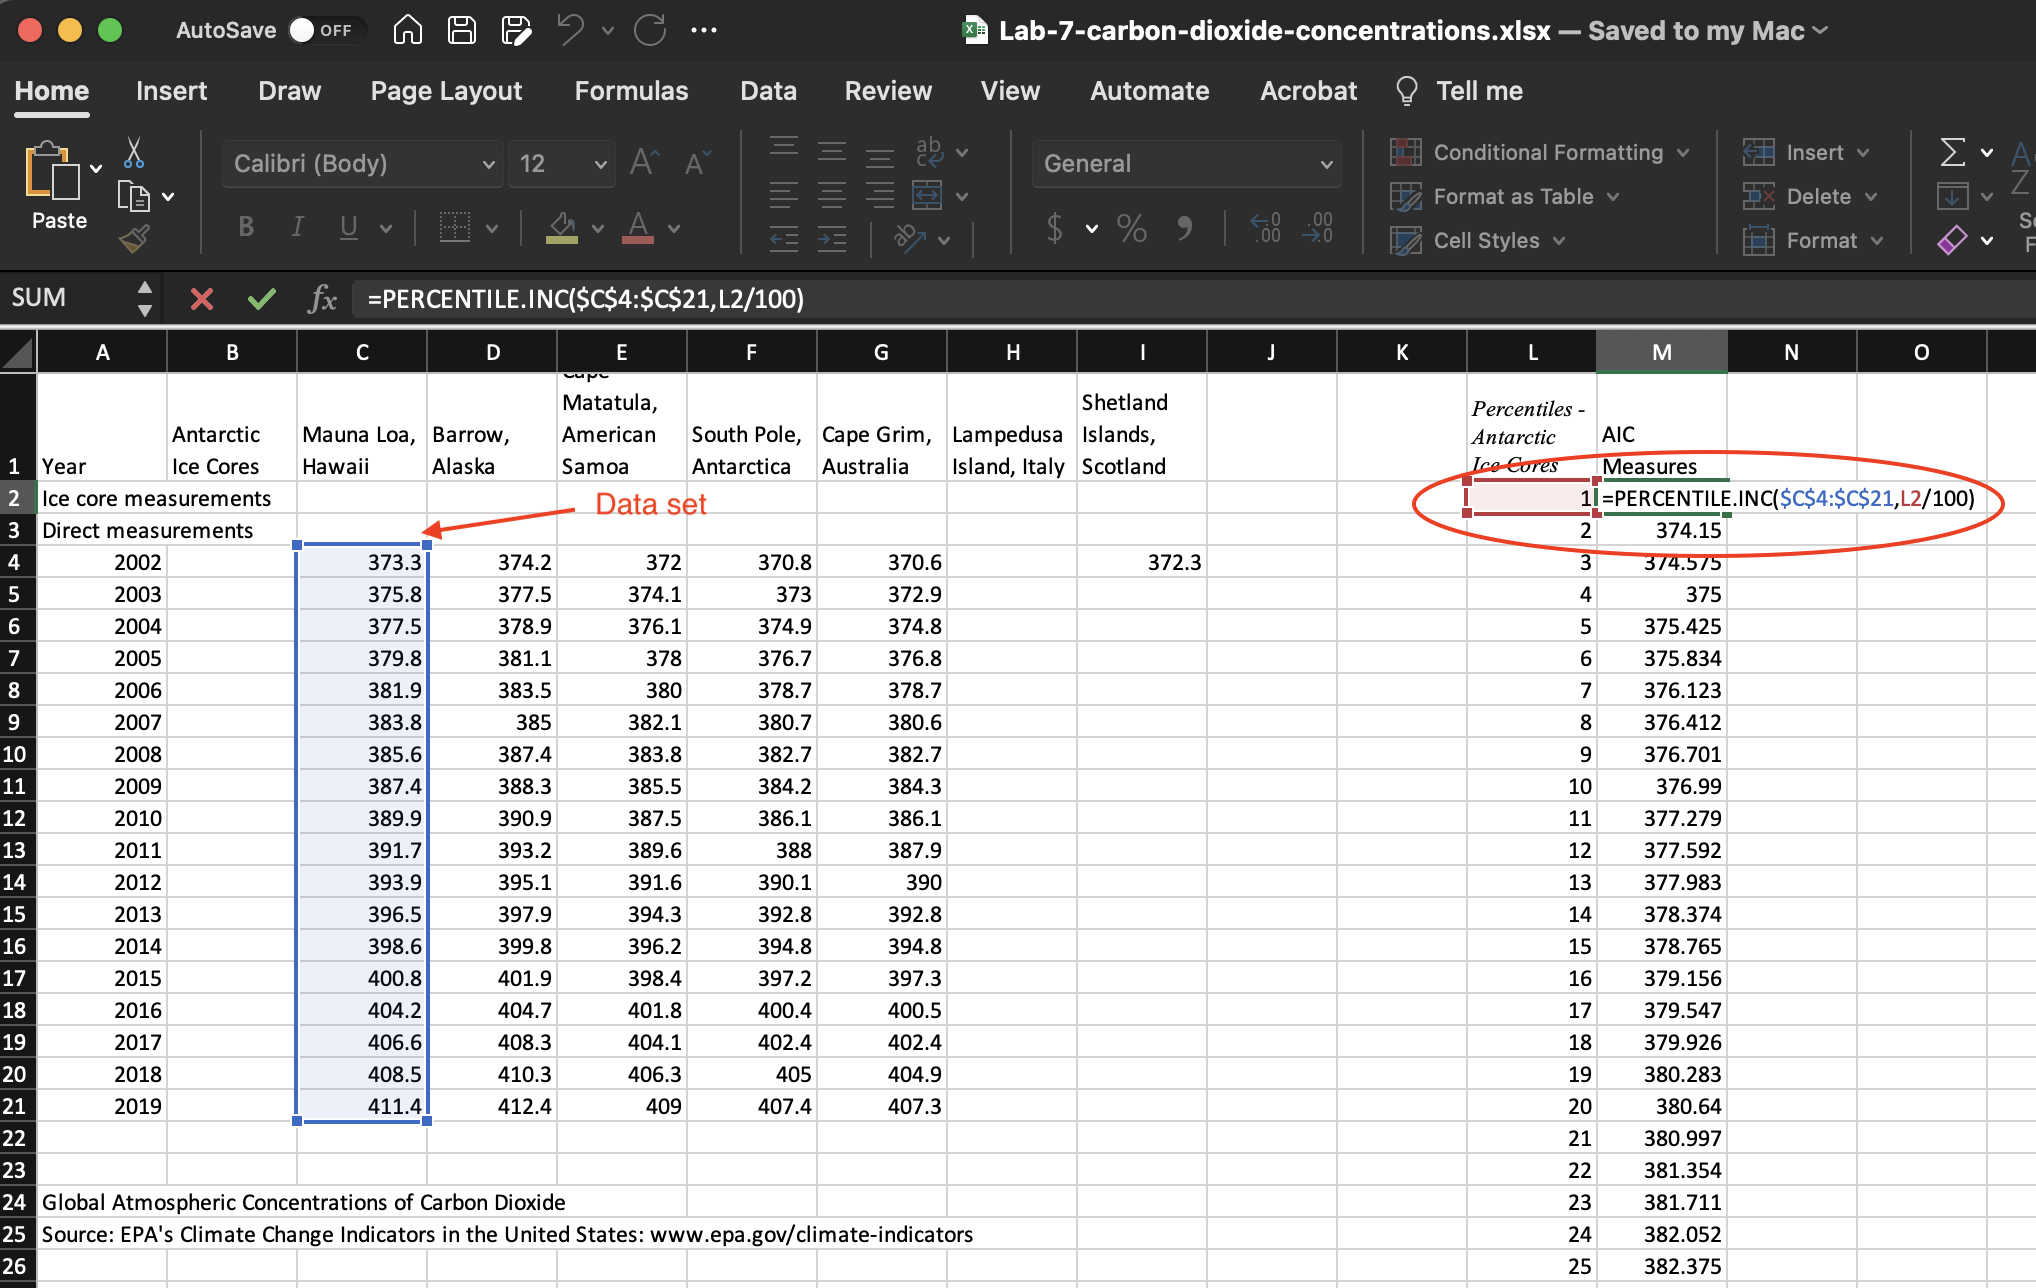
Figure 7.1: Percentiles calculations for Hawaii measures.
Note: PERCENTRANK.INC uses interpolation to find percentiles for values that are not originally in the data set.