Excel Lab Manual for Intro to Statistics
Preface
About this Manual
About the Author
License
Disclaimer
Introduction
1
Getting Started with Excel
1.1
The Excel Window
1.1.1
The Excel Window on a PC
1.1.2
The Excel Window on a MAC
1.2
Saving Excel Files
1.2.1
AutoSave on a PC
1.2.2
AutoSave on a Mac
1.3
Opening an Excel File
1.4
The Analysis ToolPak
1.4.1
Adding the Analysis ToolPak on a PC
1.4.2
Adding the Analysis ToolPak on a Mac
1.5
Checking if the Analysis ToolPak is Active
1.6
The Excel Workbook
1.6.1
The Cells in the Worksheet
1.6.2
Cell Addresses
1.6.3
Selecting Cells
1.6.4
Formatting Cell Contents
1.6.5
Changing Cell Width
1.7
Entering Data
1.7.1
Entering and Correcting Data
1.7.2
Practice 1
1.8
Arithmetic Options on the Standard Toolbar
1.8.1
Sum Function
1.8.2
Practice 2
1.8.3
Sorting Data
1.8.4
Practice 3
1.8.5
Copying Cells
1.8.6
Practice 4
1.9
Using Formulas
1.9.1
Practice 5
1.10
Adjustment to Formulas
2
Random Number Generators and Tables
2.1
Random Samples
2.1.1
Insert the function RANDBETWEEN on a PC
2.1.2
Insert the function RANDBETWEEN on a MAC
2.2
Setting the Workbook to Manual Calculation
2.2.1
Manual Calculation on a PC
2.2.2
Manual Calculation on a MAC
2.3
Using the Recalculation Mode
2.3.1
Practice 1
2.4
Creating Tables
2.4.1
Practice 2
3
Frequency Tables and Histograms
3.1
Preparation
3.2
Initial Computations
3.3
Class Limit Calculations
3.4
Creating the Histogram
3.5
Removing the
More
bar of the Histogram
3.6
Adjusting the Horizontal Axis
3.6.1
MAC
3.6.2
PC
3.7
Adjusting the Title of the Histogram
3.8
Practice
4
Measures of Central Tendency and Variation
4.1
Preparation
4.2
Using the Descriptive Statistics in Excel to Obtain the Measures
4.2.1
Practice 1
4.3
Using Excel’s Functions to Obtain the Measures
4.3.1
Practice 2
5
Time Series
5.1
Preparation
5.2
Download the Data
5.3
Preparing the Data
5.3.1
Renaming the File
5.3.2
Inserting a Column on MAC
5.3.3
Inserting a Column on PC
5.3.4
Creating a List of Sequential Numbers
5.4
Time Series
5.5
Practice 1
5.6
Practice 2
6
Pie and Pareto Charts
6.1
Preparation
6.2
Pie Charts
6.2.1
Practice 1
6.3
Pareto Charts
6.3.1
Sorting Data
6.3.2
Building the Pareto Chart
6.3.3
Practice 2
7
Measures of Location
7.1
Preparation
7.2
Percentiles
7.3
Percentile Ranks
7.3.1
Practice 1
7.4
Standard Scores
7.4.1
Calculating the Mean and Standard Deviation
7.4.2
Converting to Z-Scores
7.4.3
Practice 2
8
Box and Whisker Plot
8.1
Preparation
8.2
Five-Number-Summary
8.3
The Interquartile Range
8.4
Box Plot
8.5
Practice
9
Linear Regression and Correlation
9.1
Preparation
9.2
Creating a Scatter Plot
9.3
Calculating the Correlation Coefficient
9.4
Graphing the Regression Line
9.5
Practice
10
Coin Toss Simulation
10.1
Simulating a Coin Tossing Experiment
10.2
Counting the Number of Heads and the Number of Tails
10.3
Calculating the Empirical Probability
10.4
Practice
11
Normal Distributions
11.1
Preparation
11.2
Calculating the Mean and Standard Deviation
11.3
Graphing the Normal Distribution
11.4
Calculating Probability or Cumulative Area
11.5
Finding Raw Scores from Probabilities
11.6
Converting to Z-Scores
11.7
Practice
12
The Central Limit Theorem
12.1
Preparation
12.2
Mean and Standard Deviation of the Population
12.3
Generating Random Samples
12.4
Sample Means
12.5
The Mean and Standard Deviation of the Sampling Distribution
12.6
Practice
Published with bookdown
Introduction to Statistics: Excel Lab Manual
9.4
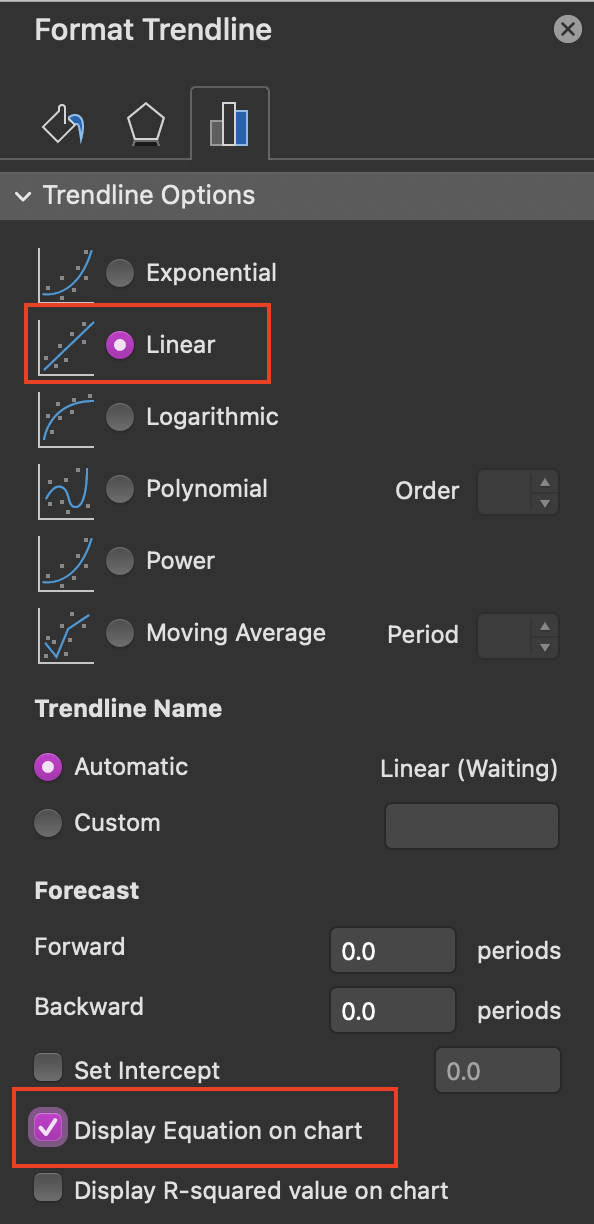
Graphing the Regression Line
RIGHT-click
on any point plotted in the scatter plot (blue points).
Select
Add Trendline
.
Select the
Linear
trend.
Check the box to
Display Equation on chart
.
Figure 9.6: Trendline options.