12.4 Sample Means
Now you will calculate the mean for each sample you generated.
- For each sample, place its sample mean below the column that contains the sample (use a similar formula to the one in Section 12.2 Mean and Standard Deviation of the Population).
- Highlight the results to distinguish them from the values in the sample.
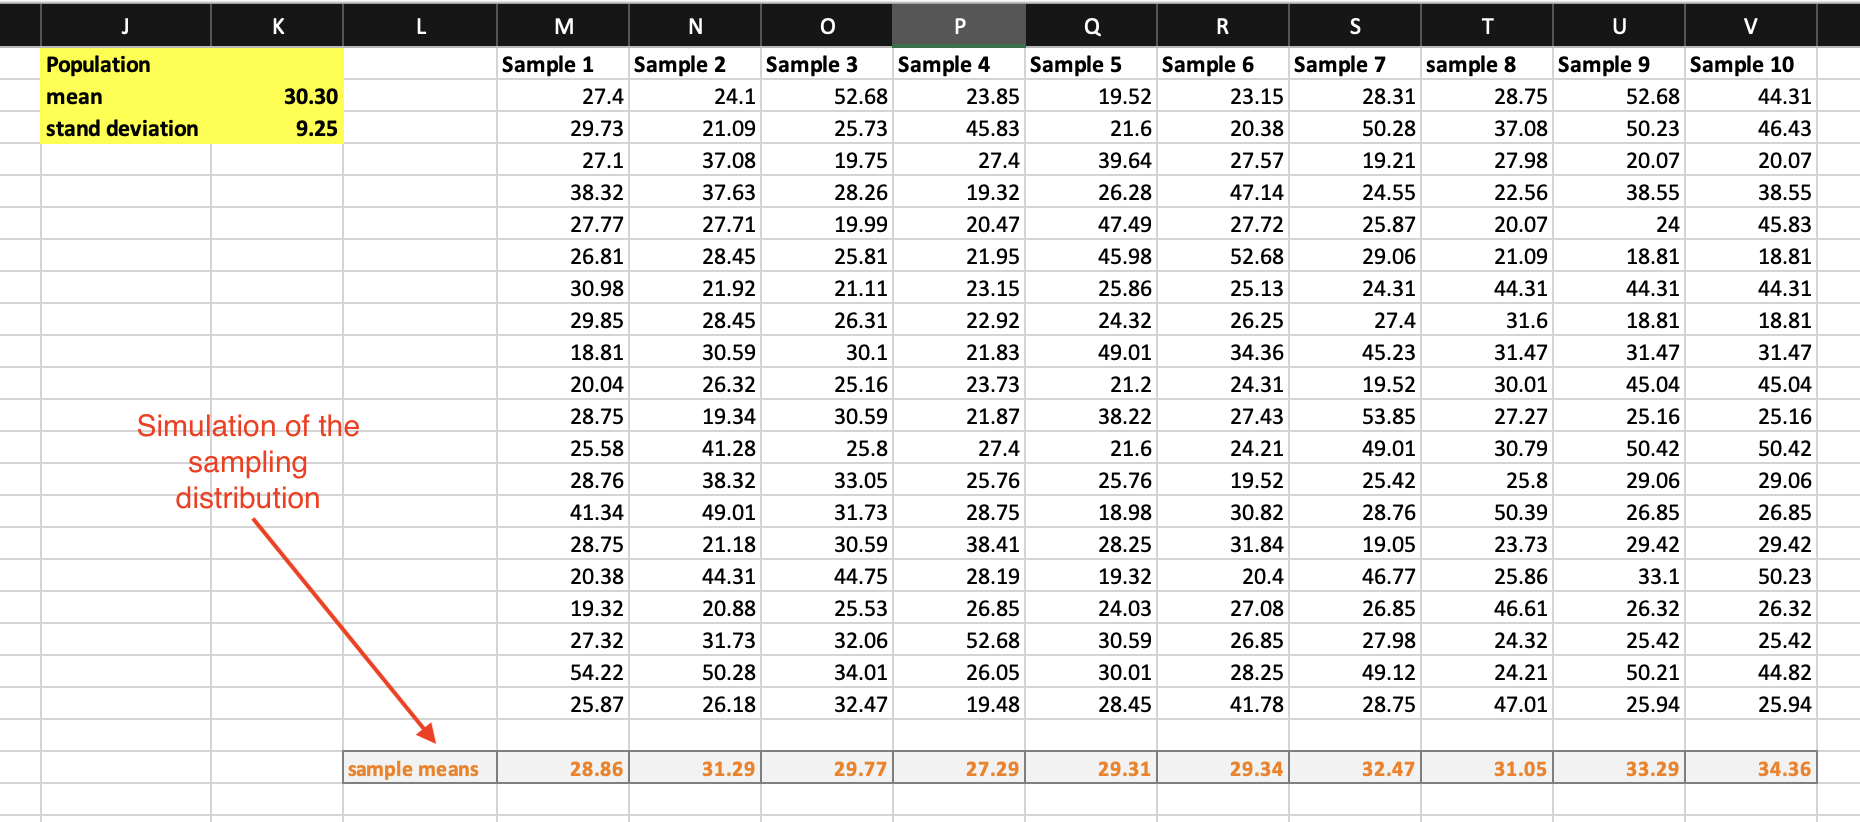
Figure 12.2: An example of the sampling mean distribution generated.