9.3 Calculating the Correlation Coefficient
- Type the label Correlation in an empty cell in the worksheet.
- In the cell below Correlation, go to the
Formulastab and click theInsert Functionribbon. - In the dialog window, search for the
CORRELfunction. ClickOK. - For
Array 1, select the cells in Column A of the data set. - For
Array 2, select the cells in Column B of the data set.
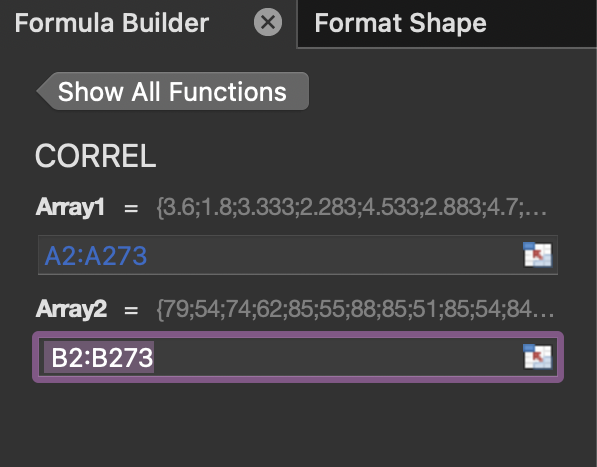
Figure 9.4: Dialog window of the Correl function on MAC.
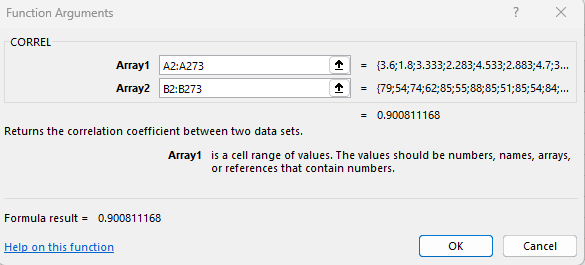
Figure 9.5: Dialog window of the Correl function on PC.
Up to 4 decimal places, the correlation coefficient is 0.9008.
##Determining the Regression Line Equation
The regression line equation (or least squares line) is a straight line that best fits the data set. The equation of the line has the form \(\hat{y}-bx+a\) where \(b\) is the slope and \(a\) is the y-intercept. The regression line explains the relationship between the independent variable (explanatory variable) and one or more dependent variables (response variable(s)).
The LINEST(known_y's, known_x's, [const], [stats]) function calculates the slope and y-intercept of the regression line. The last two arguments in the formula are optional.
- Type the label Regression Line in an empty cell in the worksheet.
- Type the formula `
= LINEST(B1:B273, A1:A273)in the cell below Regression Line.
Note: Alternatively, go to Formulas > Insert Function and search for the LINEST function.
The results output by the LINEST function is a slope equal to 10.7296414 and a y-intercept equal to 33.47439702.