3.3 Class Limit Calculations
- Type in cell C7 the label Lower Limits.
- In cell C8, type the formula
= C2. This will copy the value in cell C2 as the histogram’s lower limit for the first class. - Select cell C9, and in the formula bar, type
=SUM(C8,$C$5). Remember thedollar signbecause the value in C5, the width, is a fixed value for all formulas you use here.
- Select cell C9, and in the formula bar, type
Note: You may also do the computation in Step 3 above using the keyboard key +.
- Position the mouse pointer in the lower right corner of cell C9 until it becomes a
+sign and click, hold, and drag downward until you reach cell C12. Then release.
Note: You should have a total of 5 class limits since your histogram has 5 classes.
Note: If the formulas do not update automatically, do Step 5 below. Otherwise, skip to Step 6.
- Select
Formulas>Calculate Now. - Type in cell D7 the label Upper Limits.
7.Type the values of the upper limits of each class in cells D8 through D12.
Note: You can also be creative and use a formula to do the work in this step. There are different ways of entering the upper limits using formulas, but that is not being requested from you for this lab.
- Type in cell E7 the label Midpoints.
- Compute the values of the midpoints (lower limit + upper limit)/2 of each class in cells E8 through E12 by using Excel formulas.
Note: To do this step, use the techniques and Excel functions presented above (create the Excel formula!)
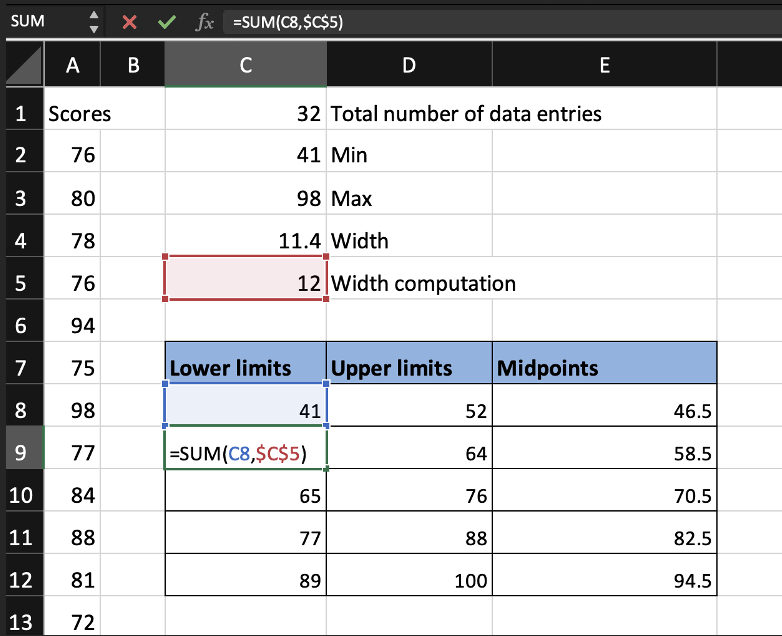
Figure 3.2: Class limits computations.