4.3 Using Excel’s Functions to Obtain the Measures
Sample 1
- Next to the column containing Sample 1 (between Sample 1 and Sample 2), click on an empty cell of the worksheet and type Mean.
- Click on the cell right next to it and type
=AVERAGE(A2:A101).
Note: You can also use the Excel function Average by clicking: Formulas > Insert Function.
- Below the cell Mean, type the word Median.
- Click on the cell right next to it and type
=MEDIAN(A2:A101). - Below the cell Median, type Stand. Dev.
- Click on the cell right next to it and type
=STDEV.S(A2:A101)(sample standard deviation).
Note: The STDEV.P calculates the standard deviation based on the entire population given as arguments and the STDEV.S estimates the standard deviation base on a sample.
- Excel does not have a Range function, so below the standard deviation type the word Range and next to it compute the range by using the formula
Range = Max – Min. - Below the cell Range, type Mode(s).
You will investigate the many modes in the data set and what they are. For that, you will use the function MODE.MULT(). This function returns a vertical array of the most frequently occurring, that is, the mode(s) of the data set.
- Starting with the cell next to the word Mode(s), select a vertical range of cells (a block of any number of vertical cells).
- While the block of cells is selected, type the function
MODE.MULT(A2:A101)into the Formula bar. - Press the keys
Control+Shift+Enter(For MAC, use the keysCommand+Shift+Enter).
Note: Be careful! If you only press Enter or use the function MODE, Excel will only display one value for the mode even if there are multiple modes.
Note: If there is no mode, #N/A will appear as a result. If there is only one mode, MODE.MULT returns the same value repeatedly.
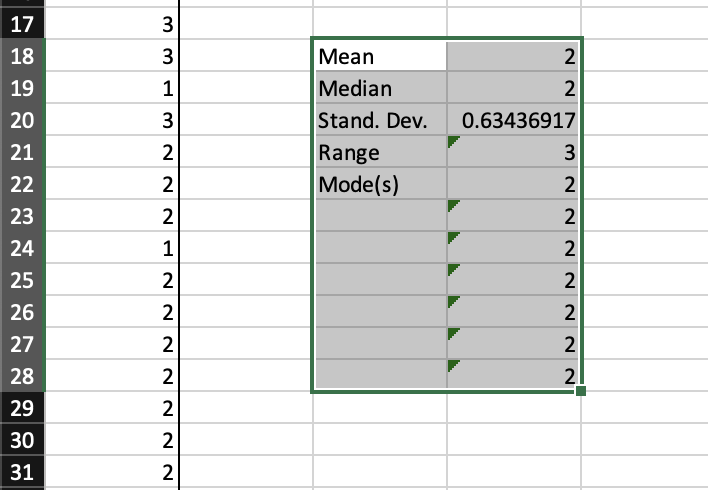
Figure 4.4: The results from the Excel functions used above..