5.4 Time Series
The following steps will guide you to build a time series for displaying your data. Use the asset’s Close prices to build the time series.
- Select all cells in both Days and Close columns.
Note: If the columns with Days and Close prices are not adjacent (separate), first select the cells in one column, and then while holding the Control key on MAC (Control or CTRL on PC), select the cells in the other column.
- Click
Insert > Scatter > Scatter with Straight Lines and Markers.
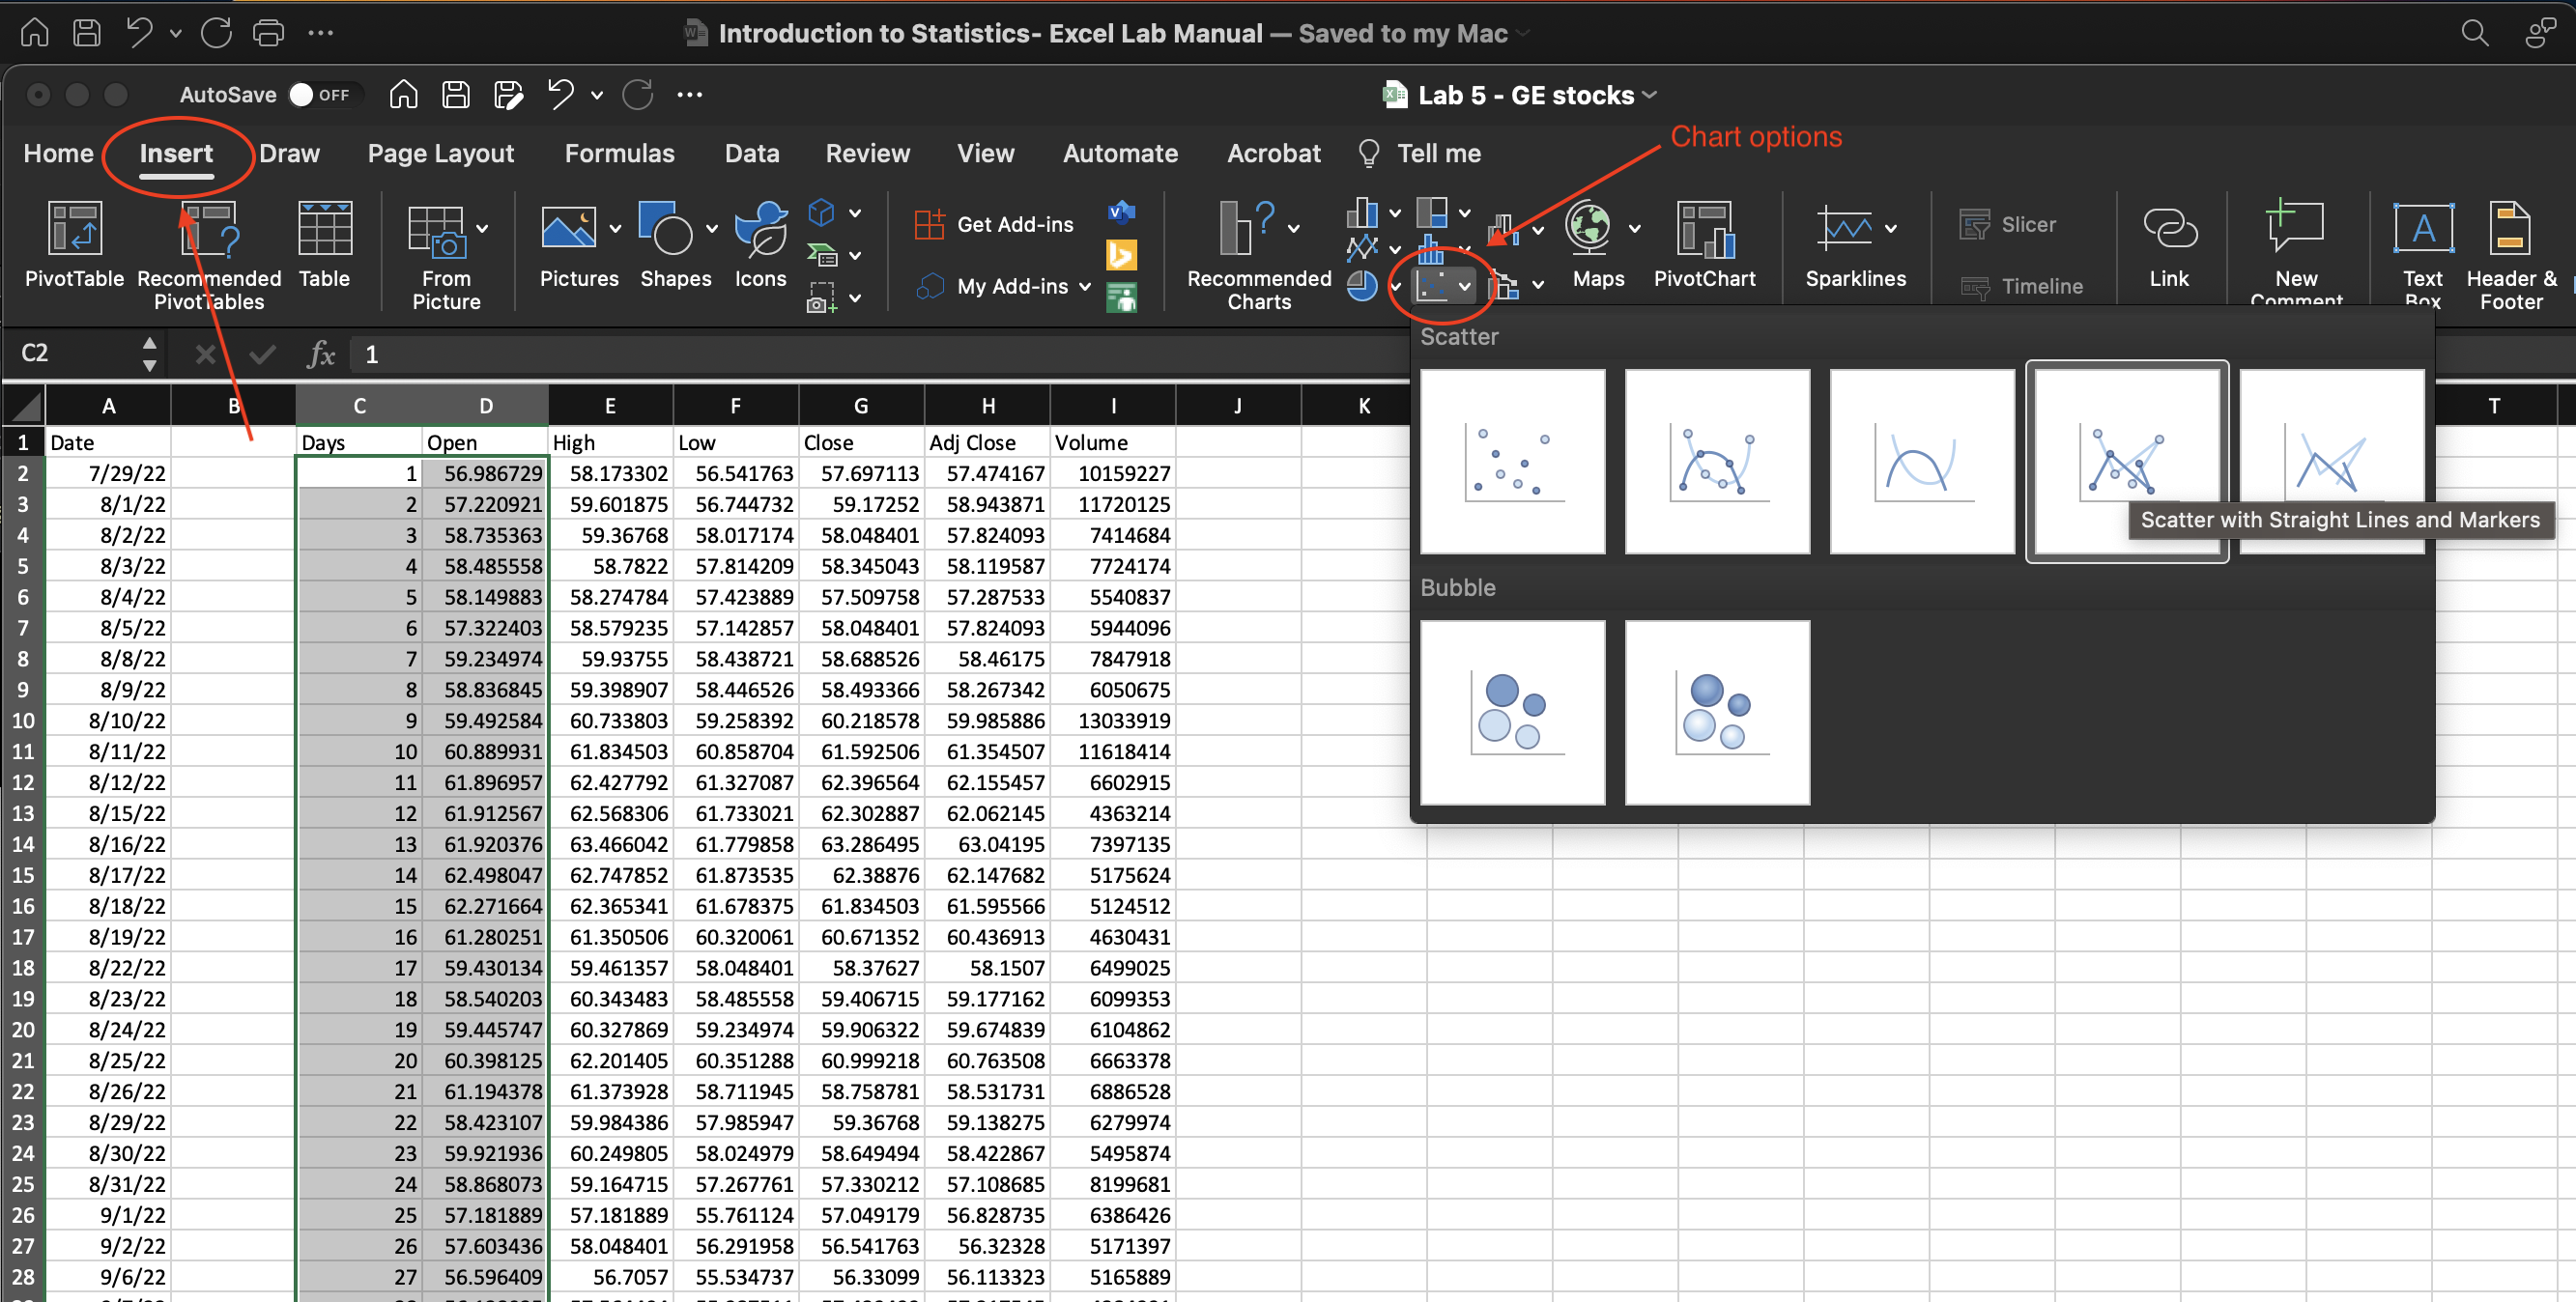
Figure 5.3: Scatter options in the Insert tab.
The resulting graph needed to be adjusted.
- Select the chart created.
- Replace the Chart Title with an appropriate title for your time series. This depends on your data set.
- With the graph selected, go to the
Chart Design tab. - To add axis titles, click
Add Chart Element > Axis Titles > Primary Horizontaland thenAdd Chart Element > Axis Titles > Primary Vertical. - Replace the Y-axis Title with an appropriate name for the vertical axis.
- Replace the X-axis Title with the word Day.
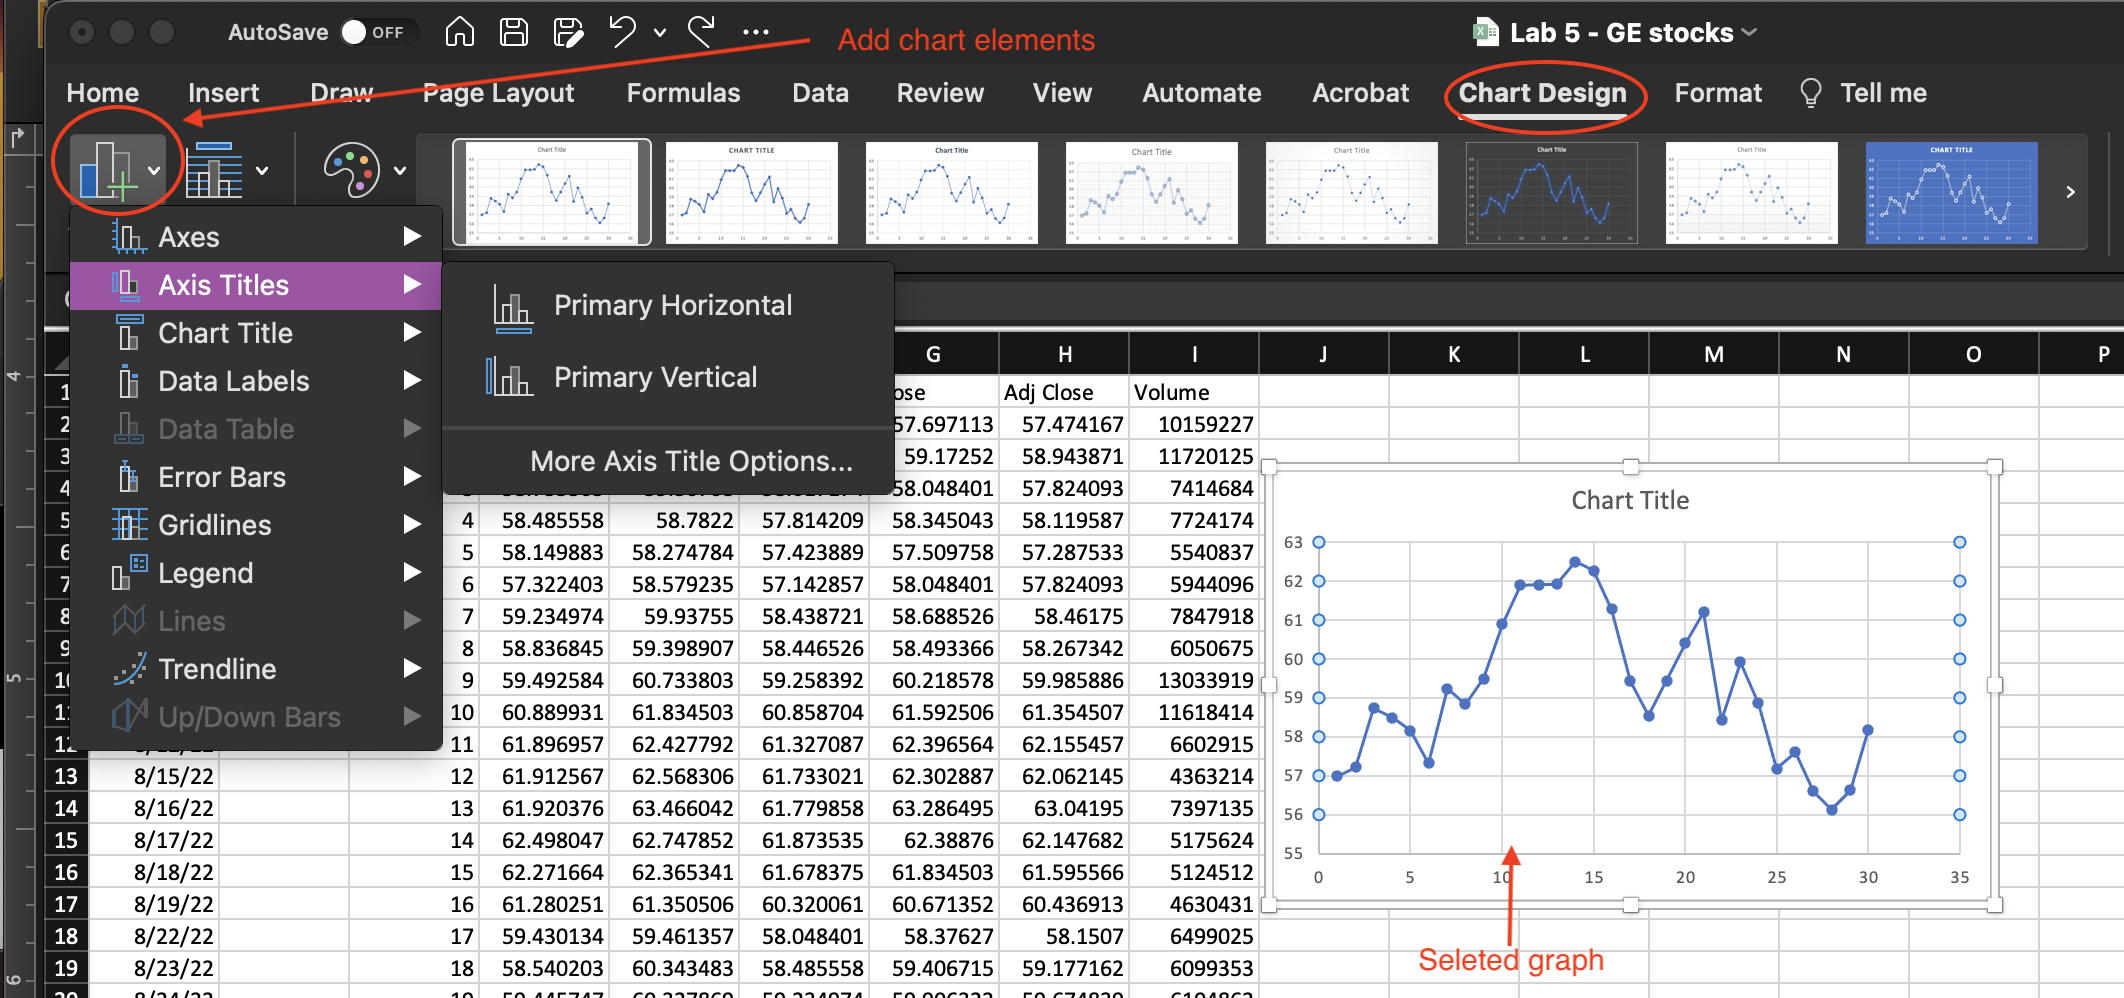
Figure 5.4: Chart adjustment options Chart Design.
- Make any adjustments necessary to the chart’s vertical and horizontal axes by
RIGHT-clickingon them and selectingFormat Axis.
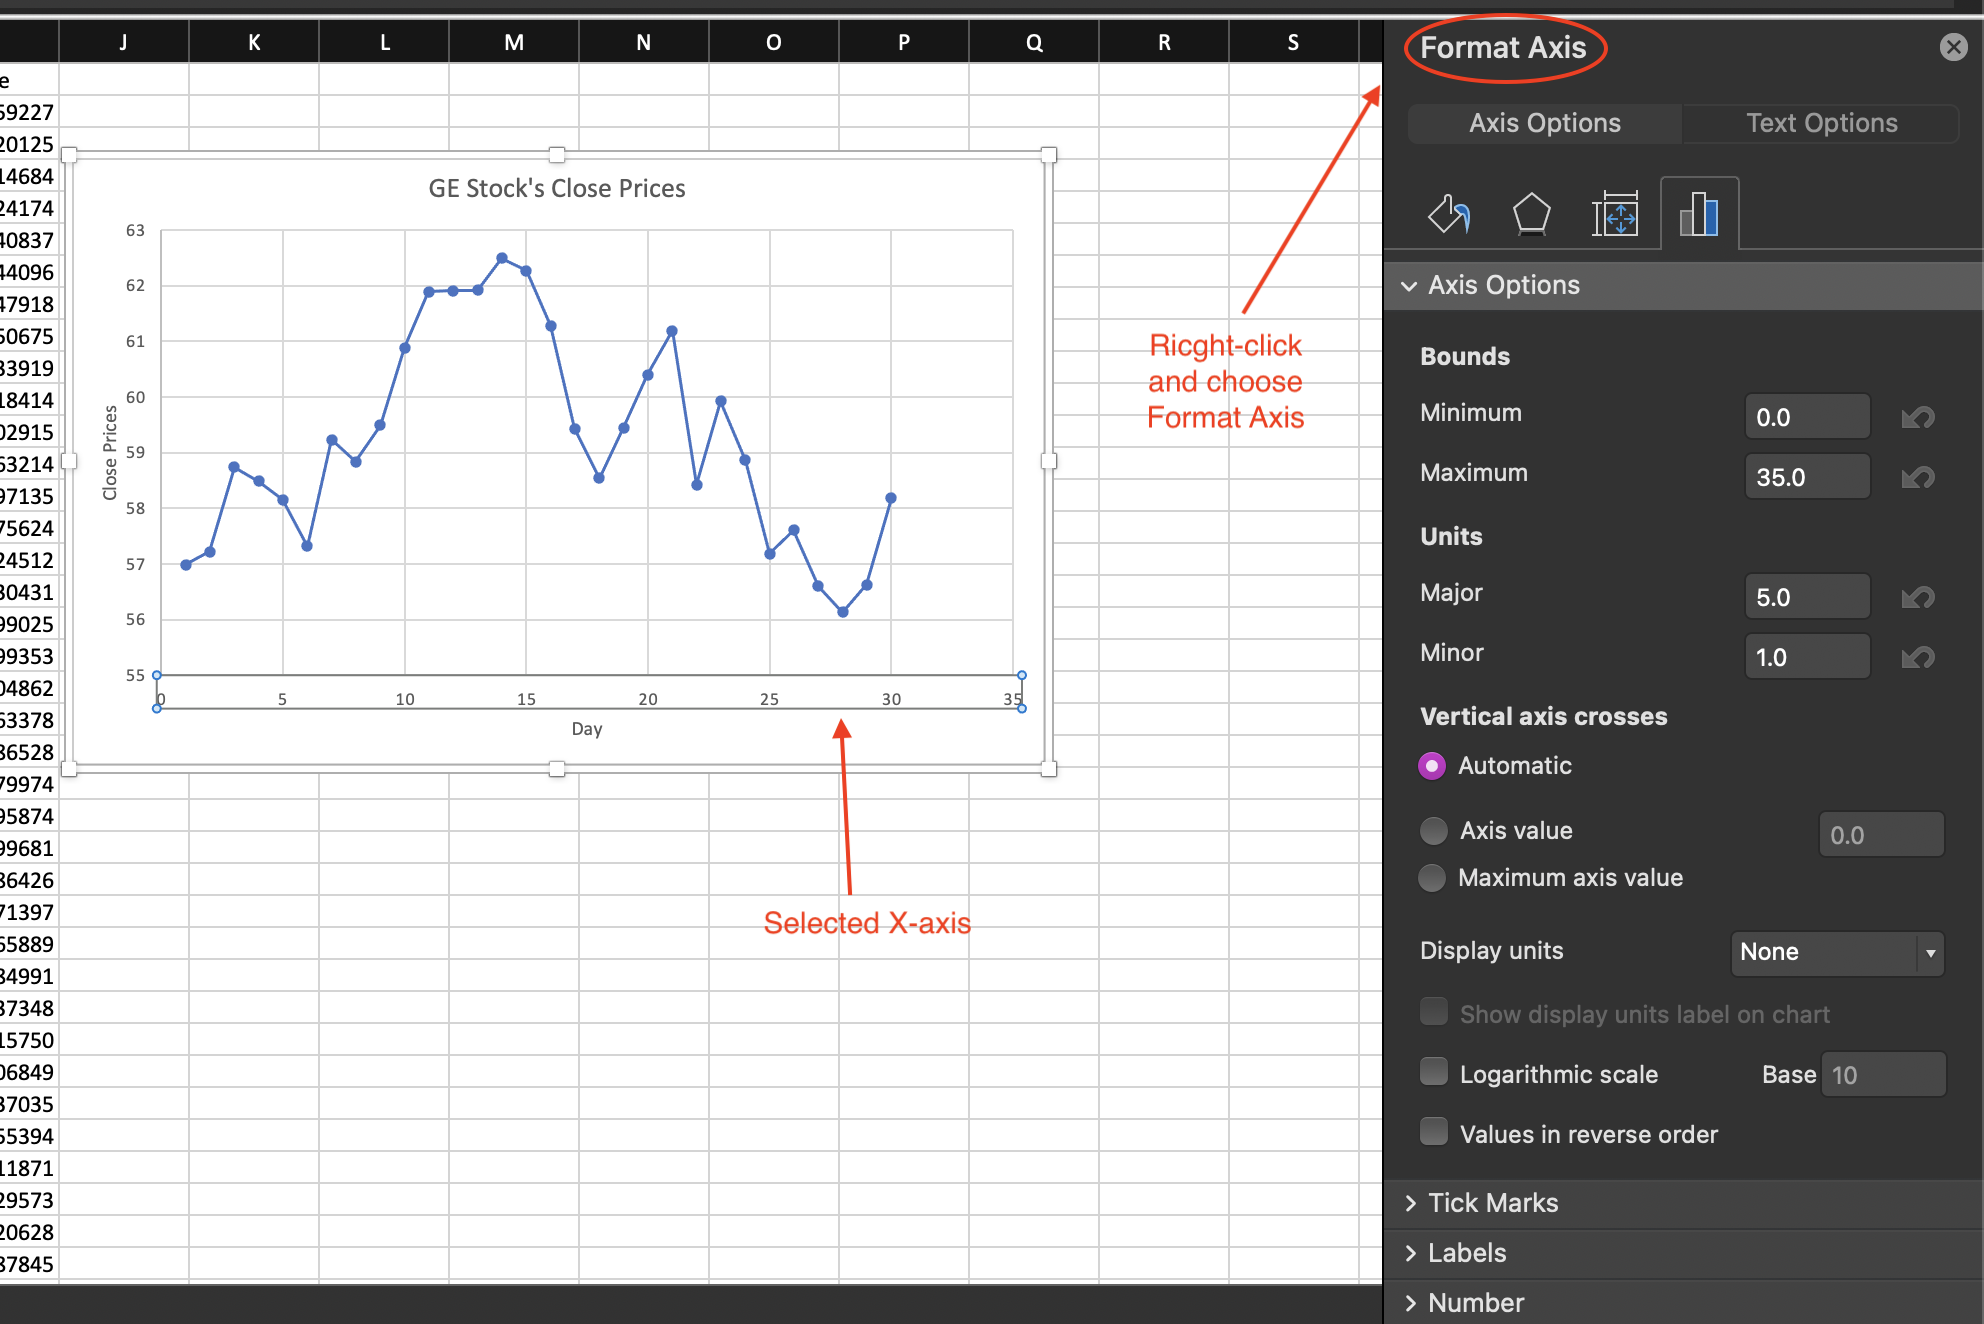
Figure 5.5: Chart adjustment of the horizontal axis.